AI architecture diagram generator.
Describe the system, or point it at the repository and let it find out for itself.
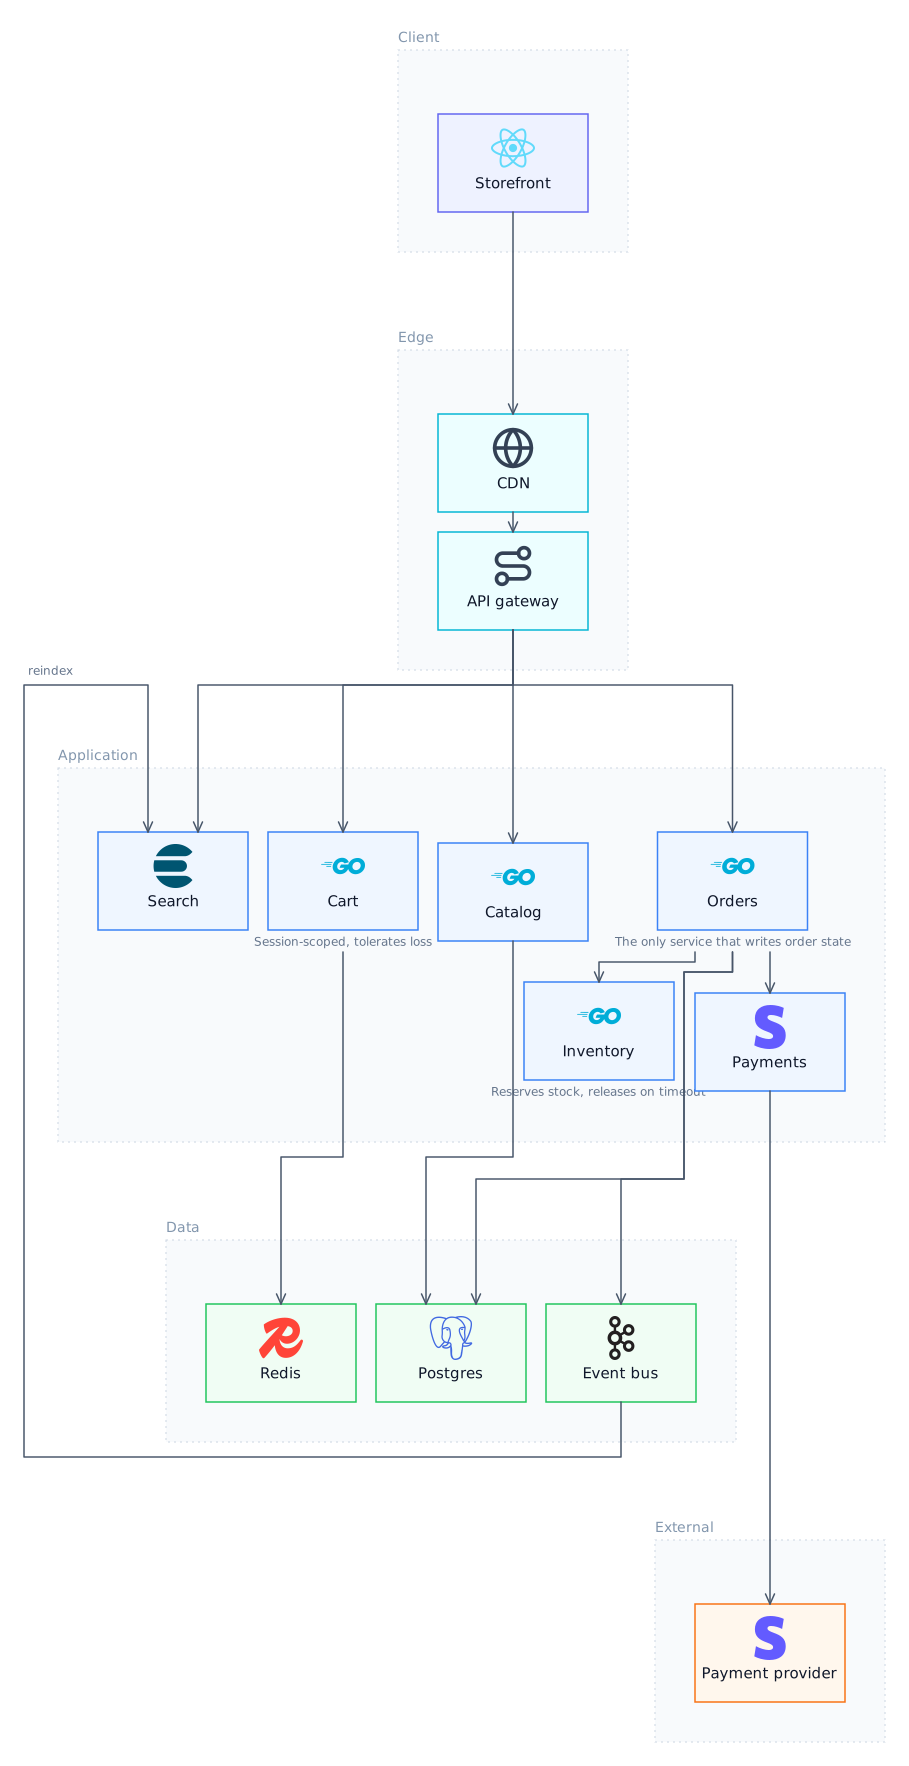
What an architecture diagram is for
An architecture diagram answers one question: what are the pieces and how do they talk to each other. It is deliberately not a deployment topology, a network diagram or a class model, and trying to make it be all of those at once is the most common reason architecture diagrams become unreadable. The useful version fits in five to fifteen boxes, groups them by tier so the direction of dependency is visible at a glance, and says something about each one rather than only naming it.
How Lucid Train draws one
Describe what you want, or point it at a repository. The agent emits a semantic graph of nodes and edges with no coordinates, and the ELK layout engine computes positions and orthogonal routing. That separation is the reason the output cannot come back with boxes overlapping or arrows crossing through cards, which is the characteristic failure when a language model is asked to place things on a canvas itself. It also means editing is editing the graph: change a component and the layout re-solves rather than drifting out of alignment.
Tiers do the work that layout usually cannot
Grouping components into client, edge, application, data and external bands means the reader knows which way dependency flows before reading a single label. It also makes an anomaly visible: a data-tier component calling out to the application tier is an upward edge and it looks wrong, which is exactly what you want a diagram to do.
From diagram to implementation
One action turns the canvas into a markdown specification listing every component, every relationship and the notes attached to them, then starts a coding turn with it. That is the direction almost nobody else supports: the tools in this category all go from text to picture and stop there.
Local, offline, your models
It runs as a desktop application. Against a local Ollama model the whole thing works offline with no API key and no telemetry, which is the practical difference from every browser-based diagram tool: your architecture never leaves the machine.
What goes in each tier
| Tier | What belongs there |
|---|---|
| Client | Browsers, mobile apps, CLIs, other systems calling you |
| Edge | CDN, load balancers, API gateways, anything terminating traffic |
| Application | Your services, workers and the code you deploy |
| Data | Databases, caches, object stores, queues holding state |
| External | Third-party services you depend on and do not run |
| Infrastructure | Observability and platform components that watch the rest |
Try it
Questions
Can AI generate an architecture diagram from code?
Yes. Point it at a repository and it reads manifests, entry points and the import graph to identify components and the edges between them. The accuracy depends on how much of the architecture is expressed in the code rather than in infrastructure you configured elsewhere.
What formats does it export?
SVG and PNG, plus the Excalidraw scene itself, so diagrams stay editable in any Excalidraw client rather than being locked to this app.
Is there a free architecture diagram generator?
The Lucid Train CLI is free and open source. The desktop app, which is where the Diagram tab lives, is $3/month with a seven-day trial. Model usage is separate: local models cost nothing.
How is this different from asking ChatGPT for a diagram?
A chat model returns Mermaid or an image, and in both cases it is choosing the visual arrangement, which is what produces overlapping boxes and crossed arrows. Here the model only decides what the components and relationships are; a layout engine decides where they go.
Related
- AI System Design Diagram GeneratorFor a design doc, a review, or the whiteboard round where you have forty minutes and need the shape to be right.
- AI Sequence Diagram GeneratorFor when the question is not what the components are but in what order they talk, and what happens when step four fails.
- AI ER Diagram GeneratorPoint it at the schema you already have. The relationships are declared, so the diagram is a rendering rather than an interpretation.
- AI Data Flow Diagram GeneratorWhere the data comes from, what transforms it, where it lands, and which of those crossings leave your control.
Last updated