An AI assistant for your existing observability stack.
Worth being precise about what this is: it drives the observability tools you already run. It is not an LLM tracing platform, and if that is what you searched for, the tools below are the right ones.
What this is not
Searches for AI observability usually mean LLM tracing and evaluation: Langfuse, LangSmith, Arize Phoenix, Helicone, Braintrust, Opik and the rest. Those instrument an LLM application and record traces, prompts, token costs and eval results. Lucid Train does none of that and is not competing with them. If you are building an LLM application and need to see its traces, use one of those.
What it actually does
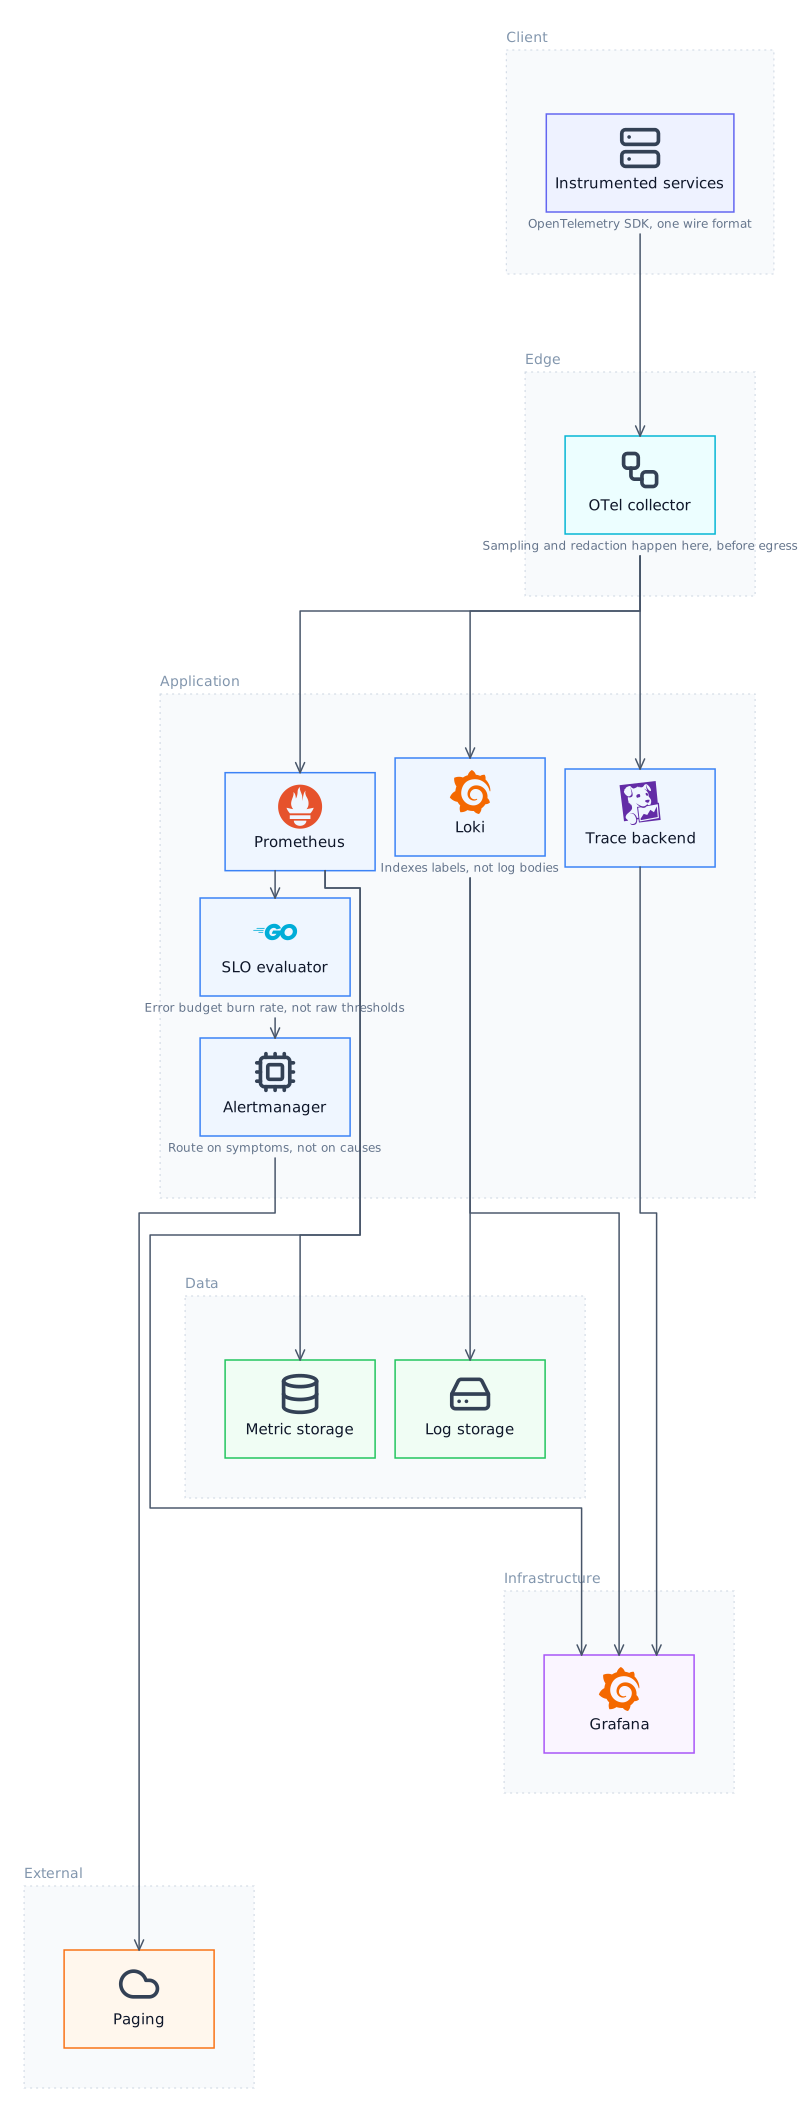
It connects to the observability stack you already run, Grafana, Prometheus and Loki, and puts an agent in front of it that can also read your repository. That combination is the point: an assistant that can query the metrics, read the logs, and then look at the code that produced them, in one place, without you moving between three tools and carrying context by hand.
From symptom to fix
The useful workflow is the whole path: a Prometheus query shows the error rate rising, a Loki query finds the log line, the agent locates the code that emits it, and then proposes a diff you review. Each of those steps exists in some tool already; doing them in one session with one context is the part that saves time.
It runs locally
Logs and metrics routinely contain data you would rather not send anywhere, which is an uncomfortable property of most hosted assistants in this space. Running against a local model means query results and log lines stay on your machine.
Where this sits
| Need | Use |
|---|---|
| Trace and evaluate an LLM application | Langfuse, LangSmith, Phoenix, Braintrust |
| Monitor LLM API cost and latency | Helicone, OpenRouter dashboards |
| Monitor agent execution | AgentOps |
| Collect metrics, logs and traces | Prometheus, Loki, OpenTelemetry |
| Dashboards over that data | Grafana |
| Query all of it and fix the code | Lucid Train |
Questions
Is this an alternative to Langfuse or LangSmith?
No. Those are LLM tracing and evaluation platforms with SDKs that instrument your application. This queries Grafana, Prometheus and Loki and can act on the code behind them. Different job entirely.
What does it connect to?
Grafana, Prometheus and Loki, with the repository alongside so a finding can turn into a fix. Connections are configured locally and credentials live in the OS keychain.
Can it write PromQL and LogQL?
Yes, and that is a good share of the value: both are easy to read and irritating to write from memory, particularly under the time pressure of an incident.
Does my telemetry go anywhere?
With a local model, nowhere. Query results stay on the machine, which matters because logs contain more than people expect.
Related
- AI Assistant for GrafanaThe value is not writing the query. It is going from the query result to the line of code without leaving the session.
- PromQL Query AssistantPromQL is not difficult, it is just impossible to remember the exact shape of a rate over a histogram at the moment you need it.
- Loki Log Analysis with AIFinding the log line is half the job. The other half is working out what emitted it and why.
- AI Design Mode for Web PagesDescribe a page and Design mode returns working HTML you can look at, click through and edit, then implement in the repo you already have open.
Last updated