Observability stack architecture.
The architecture is mostly about cost control. Collecting everything is technically easy and financially ruinous, so the interesting decisions are all about what to throw away.
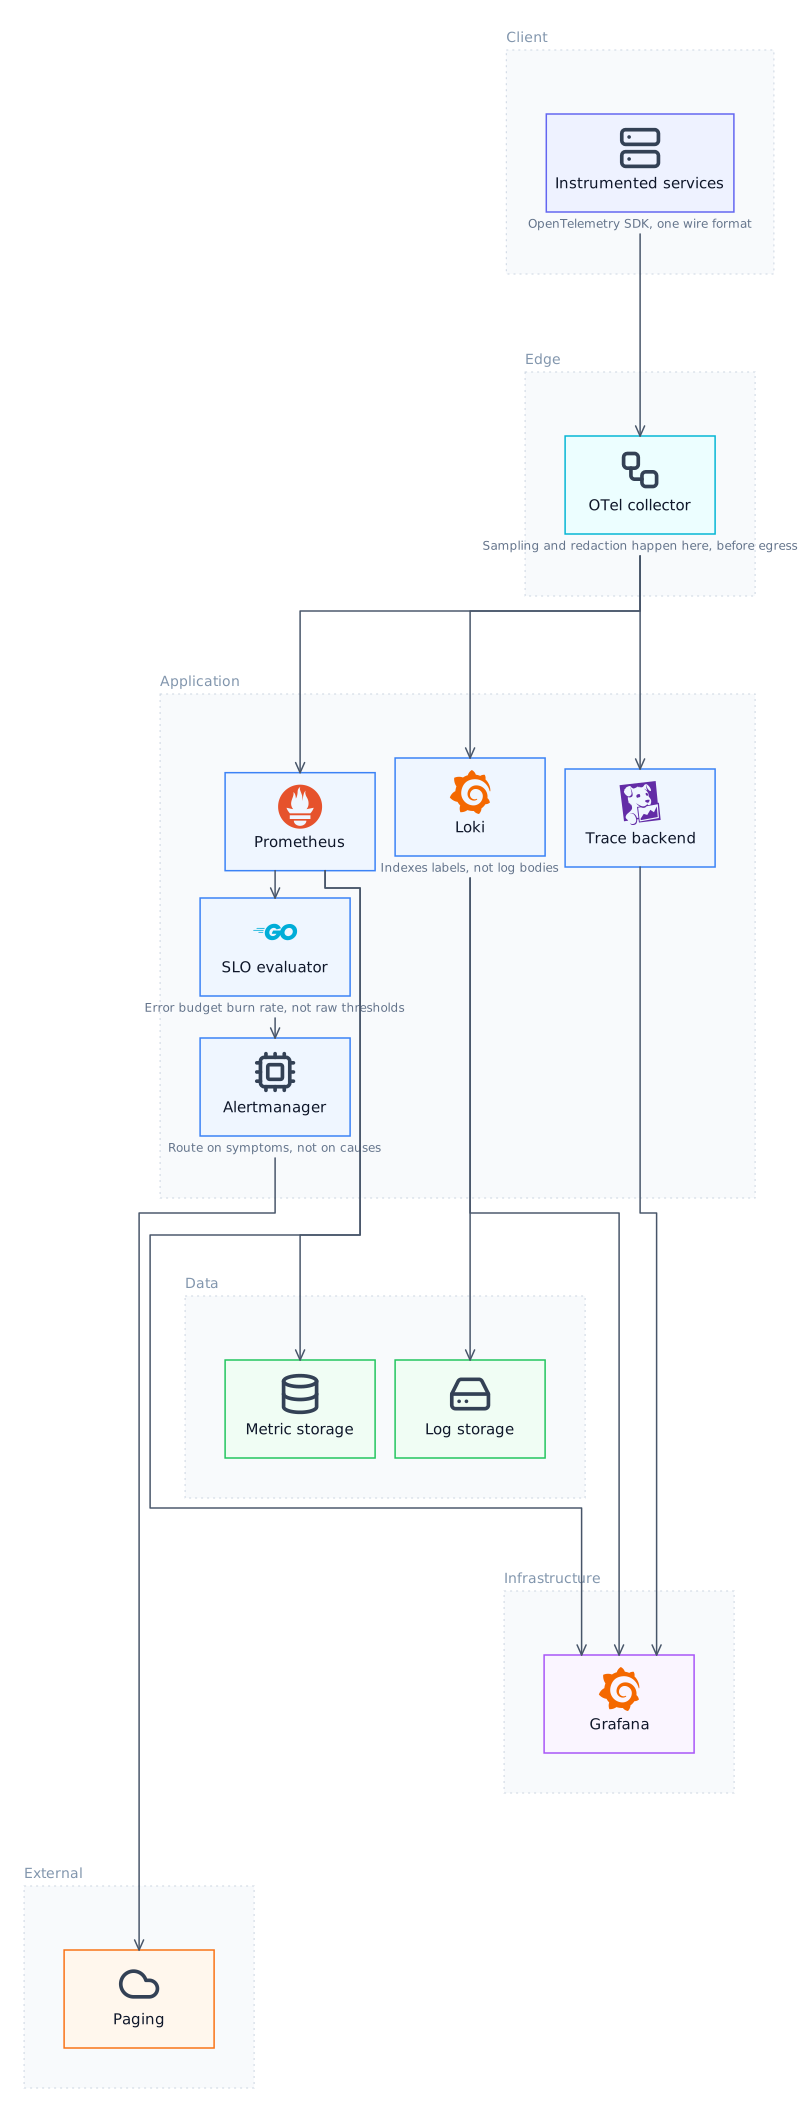
The components
Every row below is read from the graph that produced the diagram above, so the two cannot disagree.
| Component | Tier | Why it is there |
|---|---|---|
| Instrumented services | Client | OpenTelemetry SDK, one wire format |
| OTel collector | Edge | Sampling and redaction happen here, before egress |
| Prometheus | Application | Supporting component |
| Loki | Application | Indexes labels, not log bodies |
| Trace backend | Application | Supporting component |
| Alertmanager | Application | Route on symptoms, not on causes |
| SLO evaluator | Application | Error budget burn rate, not raw thresholds |
| Metric storage | Data | Supporting component |
| Log storage | Data | Supporting component |
| Grafana | Infrastructure | Supporting component |
| Paging | External | Supporting component |
Design decisions worth arguing about
A diagram shows what was chosen. It does not show what it cost, and that is usually the part that matters in a review or an interview.
One collector tier, so sampling and redaction happen once
Letting every service ship directly to every backend means sampling policy and secret redaction are reimplemented per service and per language. A collector in front gives you one place to change both, and one place where an accidental log of a token can be stopped before it leaves your network. It is another hop to run and another thing that can drop data, which is why it should be the boring, well-monitored component in the diagram.
Index labels, not log bodies
Full-text indexing every log line is what makes observability bills alarming. Indexing only a small set of labels and brute-forcing the body at query time inverts the tradeoff: ingestion is cheap, and queries are slower but usually scoped to a time range you already know. The cost is that unstructured searches across everything are painful, so label design stops being cosmetic and becomes the main thing determining whether the system is usable.
Alert on symptoms, not causes
Alerting on CPU, memory and queue depth produces pages for conditions users never notice and misses outages that show up in none of them. Alerting on error budget burn means you are paged when the thing you promised is actually at risk. It requires defining an SLO, which is a product conversation people avoid, and that avoidance is why most alerting is cause-based.
Tail sampling costs more and keeps the useful traces
Sampling at the head, deciding at the start of a request, is cheap and throws away the slow and failing traces at the same rate as the boring ones, which are exactly the traces you wanted. Deciding at the tail, once the outcome is known, keeps the interesting ones, at the cost of buffering every span until the trace completes. That buffer is real memory in the collector and is the main operational cost of doing this properly.
How it changes with scale
Cost grows with cardinality far faster than with traffic. One badly chosen label containing a user id or a request id can multiply metric series by millions and take down the metrics backend, which is why cardinality limits belong in the collector rather than in a code review guideline. Log and trace volume grow with traffic and are controlled by retention and sampling, both of which are much easier to set before the bill arrives.
Where it breaks first
The observability stack failing at the same time as the system it observes, usually because they share infrastructure. Losing visibility exactly when you need it turns a short incident into a long one. This is the argument for the alerting path in particular being independent of the primary cluster, even at the cost of running it somewhere less convenient.
Draw this yourself
Open the Diagram tab and describe the system. The agent emits a semantic graph rather than coordinates, so you can edit the components and the layout re-solves instead of drifting.
When the shape is right, Implement in code turns the canvas into a markdown specification, every component, every relationship and the notes, and starts a real turn in the Code tab with it.
Questions about this design
Do you need traces if you already have metrics and logs?
In a distributed system, yes. Metrics tell you something is slow and logs tell you what one service did; only traces tell you where the time went across service boundaries. In a monolith the case is much weaker and a profiler often serves better.
Why OpenTelemetry rather than a vendor SDK?
It decouples instrumentation from backend. Instrumenting with a vendor SDK means changing backends is a code change across every service, which is precisely the leverage the vendor is relying on.
How long should you keep telemetry?
Different answers per signal. Metrics compress well and stay useful for capacity planning, so months to years downsampled. Traces and logs are mostly used within days of being written, so short retention with the option to keep a sampled subset longer.
Can this run locally against a local model?
The stack itself runs locally without difficulty, which is how most people develop against it. If you want an agent querying it, that agent can also be local, which matters because logs and traces routinely contain data you would rather not send to a third party.
More templates
- Authentication Service DesignStateless tokens make verification free and revocation hard, and that single tradeoff explains most of the components in this diagram.
- Event-Driven Microservices DesignDistributed transactions do not exist here, so every consistency guarantee you want has to be rebuilt out of events, retries and compensation.
- LLM Inference Service DesignGPUs are the budget, so almost every decision here is about keeping them busy without letting the queue destroy tail latency.
- CI/CD Pipeline ArchitectureTwo things decide whether people trust a pipeline: how fast it is, and whether a red build actually means something is broken.
Last updated